


“An individual has not started living until he can rise above the narrow confines of his individualistic concerns to the broader concerns of all humanity.”
— Dr. Martin Luther King Jr.
As a 70s baby, I used to love the Spiderman theme song.
The singer would bellow with all psychedelic funk he could muster:
“Spiiiiiiiiiii-der Man, where are you coming from, Spiiiiiiiiiii-der Man, nobody knows who you AREEEEEEEEEEEEEEE!”
Oddly, as a window into my mind, that songs comes up often when I am seeking data about life in Champaign-Urbana; in particular the “Nobody knows who WE arrrreeeeeeeeeeeee!” refrain.
Over the past two years, I have reflected on our local celebrations of Dr. Martin Luther King Jr. versus the life experiences of African Americans across Champaign County in articles such as “MLK Celebrations vs. County Wide Disparities: Where Do We Go From Here?” “King Legacy, Whose Responsibility.”
I know we host a myriad of events celebrating Dr. Martin Luther King Jr. life and legacy.
But my annual question is: What is the state of life across communities — particularly communities of color — in Champaign-Urbana? And how do we know it?
After looking at websites and Facebook pages as varied as the U.S. Census, University of Illinois, City of Champaign and Urbana, Champaign County Board, Parkland College, the NAACP of Champaign, Champaign Visitors Bureau, The Ministerial Alliance, The Black Chamber of Commerce, The Champaign Urbana Black Greek Alliance; I stumbled upon the 2018-2020 Champaign County Illinois Community Health Improvement Plan, a potentially important document for answering such a question.
According to the document’s executive summary:
The Champaign Urbana Public Health District, in conjunction with Carle Foundation Hospital, Presence Covenant Medical Center, and United Way of Champaign County, used the Mobilizing for Action through Planning and Partnership (MAPP) model to conduct the Champaign Community Health Assessment (CHA) and Community Health Improvement Plan (CHIP). We assessed the current health status of the community, identified needs, and created a comprehensive plan to improve our community’s health by acquiring input from community partners, planners, elected officials, and residents.
The findings of the CHIP plan are based on surveys conducted via Survey Monkey and in person at local gatherings. According to the report, “County residents were surveyed from March 2017 to September 2017, with 659 total resident surveys completed. The survey was stratified by zip code, race, ethnicity, income, and age for a 99% confidence interval rate with 5% error. (Pg. 34)
Demographics of Survey Respondents:
- 29 zip codes were represented
- 70.9 % were Female, 28.3% Male, 0.8% Transgender
- 67% of the surveys were from Champaign-Urbana, while the remaining 33% was taken from the remaining towns throughout the county.
- Racial breakdown: 73% were white, 16% African-American, 4% Asian. Ethnicity: 7% were Hispanic.***
Importantly, there are a myriad of stories in this document. Here are 10 easy findings from the document:
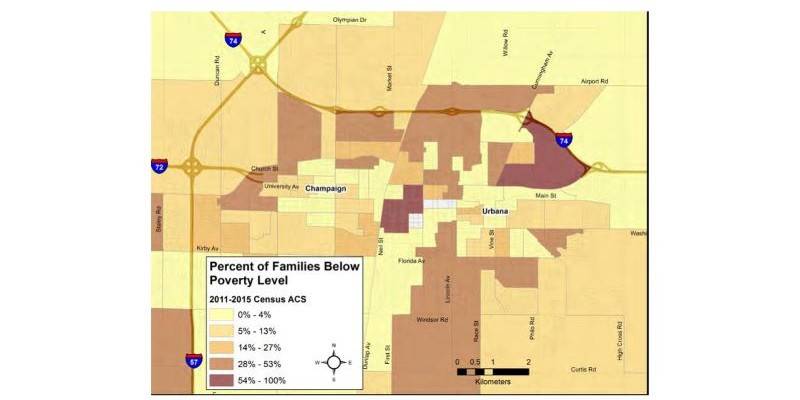
- Close to 20% of Champaign County residents live in poverty
- 25% of Champaign Residents reported being obese, a drop from 27% in 2014
- Violent crime in Champaign County is much higher than the state and national averages
- The rate of fast food restaurants per 100,000 populations in Champaign County is 92.5 is substantially higher than state and national rates of 77.67 and 74.6.
- In 2015, cancer surpassed heart disease as the leading cause of death in Champaign County with a rate of 129.8 per 100,000 populations.
Additionally as discussed throughout the report, there were other findings:
- Percentages of children in single parent households in Champaign County are higher (37%) than in other Illinois communities
- Rates of both Chlamydia and Gonorrhea are climbing in Champaign County
- Child mortality is higher in Champaign County than for other parts of Illinois
- 22.64% of the population living in Champaign County has low food access
- Champaign has slightly more particulate matter-air pollution than the state or national average
Consequently, I had so many questions about the report itself and how the data broke down more specifically by race/ethnicity, I reached out to Champaign Urbana Public Health District Administrator Julie Pryde to help me better understand the report.
Smile Politely: You said you believe that I am one of the few people who read the report.
Julie Pryde: (Laughing) I think so, but I can’t know that for sure.
SP: I’m three years late to the dance, but for a document that gives us so much current information and data about our community, our county; you would think there would be more interest.
Pryde: When we first started collecting this data about 20 years ago, it was part of a requirement for the Health Department, and it was just sort of a joke.
It was just 10 people sitting around a table putting 10 things on paper and then putting the report on a shelf and do nothing with it. However, every year we try to do better with how we do it. We use a process called MAPP (Mobilizing for Action through Planning and Partnerships).
This year (as they prepare the 2021-2023 report), we are doing even more. We are going to start this month. And if you are interested in being on that group, we would love it. We try to get a huge array of people involved. Media is important. People don’t realize it, but the media is very important.
SP: How did you do your data collection for the 2018-2020 report?
Pryde: We met with different community agencies. Then, we did a community survey. We do them online, but we also go out to places that are underrepresented in the county. The Survey Monkey data is easy. You put it out there and whoever takes it, takes it. Then, we look at the data to be sure that our data looks like the community.
This time we are going to ramp up the community meetings in Champaign-Urbana. This year, we are going to focus on underrepresented voices. Like we are preparing to do with the 2020 Census, we are trying to amplify the voices of underrepresented in our surveys.
It is hard to get people to understand the importance of being counted, but being counted drives how power and money are allocated at the local level. People use these reports for information gathering and to write grants so we need to be sure that we are doing a better job.
SP: Yes, but it is worth noting that according to your data and looking at the census data for Champaign county, women and rural respondents are overrepresented in your report. Additionally, men and Asian communities are underrepresented in the report.
On page 39, some of the documents findings are discussed based on race and ethnicity. Is the data available to break out the findings discussed based on the race/ethnicity of the respondents?
Pryde: Yes, it’s available. Also, for next time, we got a grant from the National Association of County Health Officials specifically for reaching out to disability groups. We are only two places in the country to receive such a grant. So, the next Community Health Improvement Plan will be a lot different. Every year, we try to make it better.
SP: Again, the thing that stuck with me is that women and rural communities are overrepresented in the data.
Pryde: I’m not sure they are overrepresented. They shouldn’t be, but that doesn’t mean that they aren’t.
SP: The document states that rural respondents participated at the level of 33% even though they only represent 13% of the county. Regarding women, the document states that 70.9% of the participants are female, but women make up 50.2% of the Champaign County based on census data.
Pryde: If rural people are overrepresented, I don’t know why. Women, on the other hand, are always overrepresented because women are more willing to participate in surveys. Women are always willing to step up and participate.
SP: Yet, when you go to community meetings, it’s often mostly men speaking, presenting or leading the conversations?
Pryde: Yes, but who is in the audience? It’s mostly women.
SP: It looks like increased outreach to men and to the Asian community are needed for the 2021-2023 report.
Pryde: We especially need to hear from African American and Latino men. Men tend to shy away from health related stuff in general. No matter how we program, it has always been more difficult to get participation from African American and Latino men. We need to expand our networks and meetings that we go to.
_____
So, again, as we feel great pride in King’s legacy, I hope that this reporting allow us to reflect on local realities and concerns for our shared future. We owe it to ourselves to make sure that we know as much as we can about our community via reports so that we can:
- Make sure that we understand the findings.
- Assess whether our resources are being used most effectively.
Our county cannot be served appropriately if communities are not represented properly or are not involved in the conversations around reports that drive funding and resource allocation.
I hope that more organizations review this document to find out how their constituencies have fared in Champaign-Urbana during the second decade of the 21st Century.
Additionally, our community is constantly programming. Yet, this Community Health Improvement Plan cost upwards of $100,000 to produce, according to Director Pryde. Thus, this plan should be on the tables and in the discussions of community leaders and community organizations every time you plan and program.
Finally, if you or your communities are not represented as clearly as you might like, I hope you will find your way to upcoming IPLAN meetings as the 2021-2023 data collection begins.
For more information on the 2021-2023 IPLAN meetings, contact Chaundra Bishop at [email protected]. Also, follow the Champaign Urbana Public Health District Facebook page to get additional information.
Top image: A map of Champaign County that uses shades of brown and yellow to indicate percentages of families in poverty in specific areas.