


I typically recap our local weather on a monthly basis, but with a holiday hiatus, we’re going to cram December and January together into one big hunt for true winter.
From the commentary I’m seeing on social media and the threats that I’m getting from snow-lovers at the grocery store, folks aren’t so sure we’ve really had any winter weather yet. And honestly, that’s mostly true. I’m including a map and a little chart for the data nerds.
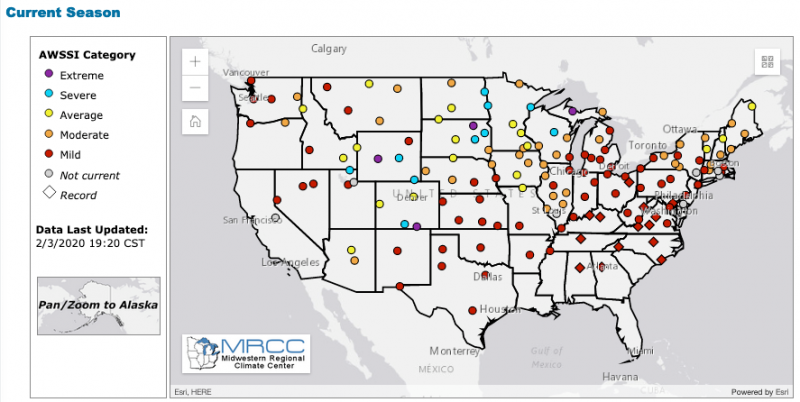
Image: A map of the United States with colored dots scattered across it. Image from Midwest Regional Climate Center.
You’re looking at the Accumulated Winter Season Severity Index, or AWSSI. This product is put out by the Midwest Regional Climate Center. It combines a location’s average temperature with total snowfall for the season compared to the typical values for this time of year, and rates the season on a scale from mild (warmest/least snowy) to extreme (coldest/snowiest).
According to the AWSSI on February 3rd, we’ve experienced a moderate winter. If we don’t get some cold air and snow in here soon we’ll be crossing into the mild range soon. If you look around the map, there aren’t many blue dots to be found. In fact, there’s an awful lot of red, or “mild winter” dots. Much of the Lower 48 has experienced warmer than average winter. The folks in the Dakotas and northern Minnesota have taken their winter lumps. In fact, parts of North Dakota had already received their entire winter’s worth of snow by mid-December.
If you’d have shown me that map, covered in red dots, back in mid-November I’d have laughed and called you a liar. Can you remember what we were dealing with back then? I’ll remind you.
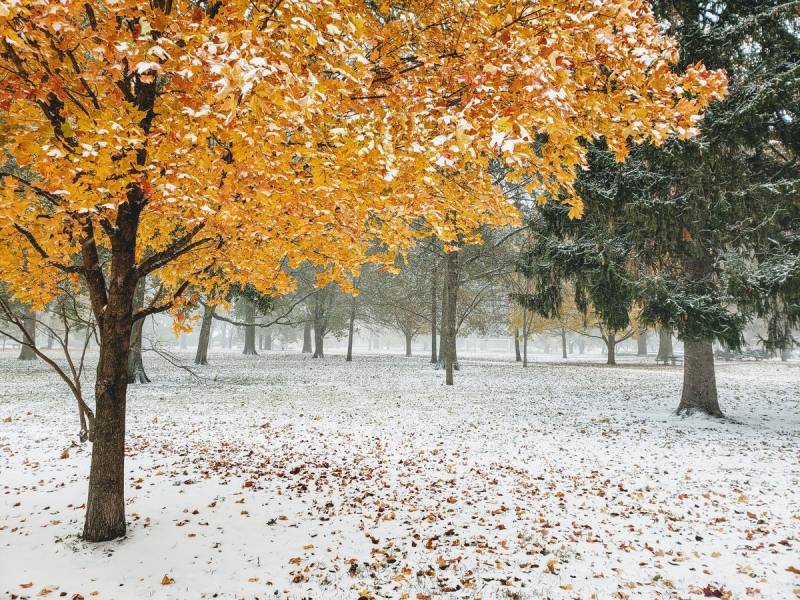
Image: A grove of trees. In the foreground is an evergreen tree and a tree with orange leaves. The ground is covered with a layer of snow. Photo by Andrew Pritchard.
We saw accumulating snow on Halloween, and then set record low temperatures into mid-November. Record low temperatures were set on November 11th, 12th, and 13th, with a record low high temperature also set on November 12th. We haven’t felt air like that since! Truly.
December started out as if it meant well enough. Sandwiched in between spurts of 40 and 50 degree days were a couple of chilly overnights with lows in the teens. We picked up 2.7″ of snow December 15-16 which helped send our overnight lows tumbling into the single-digits on the 18th and 19th. Any hope of a snowy holiday season in C-U came to an abrupt end as the jet stream went through a major pattern change shifting the Midwest into much warmer than average conditions. That background pattern within our jet stream has essentially stayed put ever since.
From December 21st to January 15th we enjoyed a streak of 26 consecutive days that were warmer than average. Almost as wild as that streak is the fact that it was never really in jeopardy of being broken during its run. Many of these days were way, way warmer than average. Sixty-three degrees on Christmas Day? Sixty-four degrees the 26th? Both are new records. On into January the streak went.
December 2019 came to a close with an average temperature of 34.5 degrees, which is 5.6 degrees warmer than average. The month finished on the dry side with 1.82″ of total precipitation, below our December average of 2.73″. No surprise that our monthly snow total took a hit as well. The average December snowfall in Champaign-Urbana is 6.6″, well above our December 2019 total of 3.2″.
January continued to be warm but brought the spring rains with it. The period from January 10-12 brought 4.16″ of rain in Champaign-Urbana. Our typical January total is 2.05″. That’s an entire month’s worth of rain, in just three days. My basement took a week to dry out!
On January 16th, with a high temperature of 29 degrees and a brisk overnight low of 17 degrees, the streak finally ended with a day that was 2 degrees cooler than average. The chillier weather brought with it a little fake winter fun, as several storm systems passed through the Midwest delivering snow to regions to our north while teasing us with cold rain, sleet, and at times a dusting of snow.
Fake winter ended as quickly as it began, and on January 22nd we began a new streak of warmer than average days that hadn’t come to an end by the time January’s time was up. In fact, I’m writing these words on the 13th consecutive day in the new streak, on a day where our high temperature was likely near 60 degrees.
January 2019 ends 6.9 degrees warmer than its average of 24.8 degrees. Scrolling back up a few paragraphs, that’s an even wider margin than December beat its average temperature by. It’s no surprise that we crushed our average monthly precipitation number in January. 5.23″ of total precipitation more than doubles our typical average of 2.05″.
Where is the rest of February headed? We could pick up a little snow from a mid-week storm system this week. If we end up hitting the bullseye on what is expected to be a relatively narrow swath of accumulating snow splitting through central Illinois on Wednesday night, it could be enough to scratch the itch of our local snow lovers.
That said, hoping for any sort of late-rally in the form of extended bitterly cold temperatures or multiple significant snowstorms seems bleak these days as we look into the meteorological crystal ball. In fact, I see a lot of the same as we head through the rest of the month of February. We’ll see cold days, it’s still winter. But I think the warmer than average days will outnumber the cold days, and I’d be prepared to come up on the rainy side of these storm systems more often than not.
February 2020 likely ends just like it began; warmer than average, with near-average precipitation but below-average snowfall. For context, the average monthly temperature for February in Champaign-Urbana is 29 degrees, the average total precipitation is 2.13″ and average monthly snowfall is 5.8″.
Andrew operates Chambana Weather, where he publishes daily weather information for Champaign-Urbana and surrounding communities. He is also an agricultural meteorologist with Nutrien Ag Solutions at Research Park, focused on domestic and international weather and its impact on ag.
Champaign-Urbana monthly climate statistics are courtesy of the Illinois State Water Survey.